Tracking the right safety KPIs (Key Performance Indicators) is the difference between a reactive safety program and a proactive one. This guide covers the 15 most important safety metrics every safety manager should track on their dashboard.
What is a Safety KPI?
A Safety KPI is a measurable value that demonstrates how effectively an organization is achieving its safety objectives. Safety KPIs fall into two categories: lagging indicators (measure past events like injuries) and leading indicators (measure preventive actions like training completion).
Top 15 Safety KPIs for Your Dashboard
Lagging Indicators (Outcome Metrics)
1. Total Recordable Incident Rate (TRIR) - The number of recordable incidents per 200,000 hours worked. Formula: (Number of incidents x 200,000) / Total hours worked.
Free Download: 5 Safe Work Procedures
Choose from 112 professionally written SWPs. No credit card required.
Get Free SWPs2. Days Away, Restricted or Transferred (DART) Rate - Measures incidents serious enough to require time away from work. Lower is better.
3. Lost Time Injury Frequency Rate (LTIFR) - Number of lost-time injuries per million hours worked.
4. Severity Rate - Number of lost days per 200,000 hours worked. Shows the seriousness of incidents.
5. Near Miss Reporting Rate - Number of near-misses reported. Higher is actually better - it means workers are reporting hazards before they become incidents.
Leading Indicators (Preventive Metrics)
6. Safety Training Completion Rate - Percentage of workers who have completed required safety training on time.
7. Inspection Completion Rate - Percentage of scheduled inspections completed on time.
8. Toolbox Talk Attendance - Average crew attendance at daily safety talks.
9. Hazard Identification Rate - Number of hazards identified and reported per period.
10. Corrective Action Close Rate - Percentage of corrective actions completed within their due date.
Compliance Metrics
11. Regulatory Compliance Score - Overall percentage score based on completed regulatory requirements.
12. Open Corrective Actions - Number of corrective actions currently open/overdue.
13. Equipment Inspection Status - Percentage of equipment with current inspection certificates.
14. Worker Certification Status - Percentage of workers with current, non-expired certifications.
15. Incident Investigation Timeliness - Average time from incident to completed investigation.
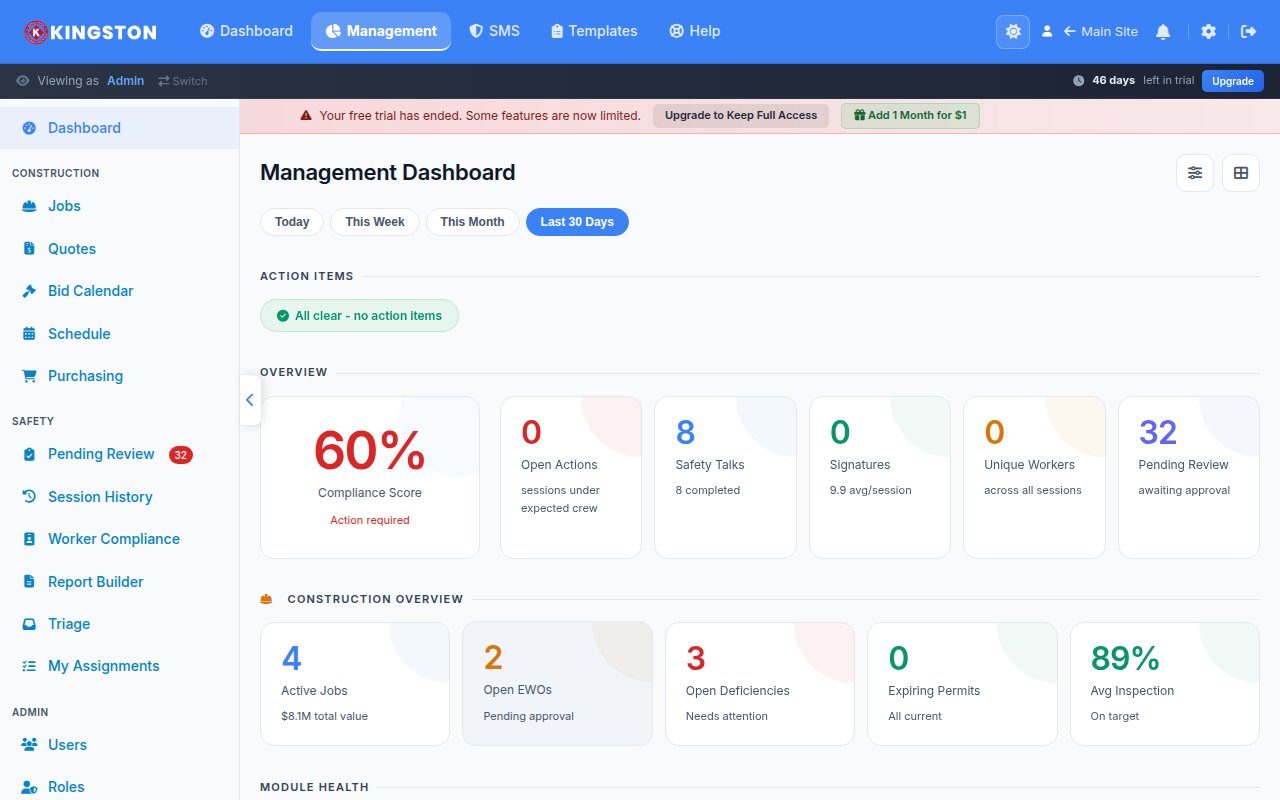
How to Build a Safety KPI Dashboard
A safety KPI dashboard should give you an at-a-glance view of your safety program health. The best dashboards combine real-time data with trend analysis to help you spot issues before they become incidents.
Key features of an effective safety dashboard:
- Real-time compliance score
- Trend charts showing improvement or decline
- Color-coded alerts for overdue items
- Drill-down capability to see details
- Mobile access for field supervisors
Track All 15 KPIs Automatically
Make Safety Easy calculates your safety KPIs automatically from your toolbox talks, inspections, incidents and corrective actions. No spreadsheets needed.
FAQ
What are the most important safety KPIs?
The most important safety KPIs are TRIR (Total Recordable Incident Rate), DART Rate, near-miss reporting rate, inspection completion rate and corrective action close rate. Leading indicators like training completion and hazard identification are increasingly valued over lagging indicators alone.
What is a good safety KPI score?
A good TRIR depends on your industry - the national average is around 3.0, but top performers achieve below 1.0. For leading indicators, aim for 95%+ on inspection completion, training completion and corrective action close rates.
How do you measure safety performance?
Safety performance is measured using a combination of lagging indicators (incident rates, severity rates) and leading indicators (inspection rates, training completion, near-miss reporting). Modern safety programs weight leading indicators more heavily because they predict future performance rather than just measuring past failures.
Go Digital with Make Safety Easy
Replace paper checklists with one platform your whole team can use.